There is No Emergency
Two years of COVID deaths compared to other causes of death in official Canadian statistics
For two years, the federal and provincial governments of Canada have governed by fiat on the pretext of an “emergency” so grave that our jackbooted rulers have no time to follow the niceties of a centuries-old constitutional process. Two years of emergency rule. Yet official government cause of death data tell us that for most people, there never was an emergency. The definition of emergency tells us that if there ever was one, it is over.
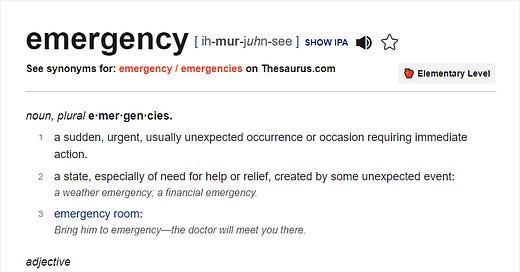
Before we jump to the cause of death data, let’s linger for a moment on the definition of “emergency” which to a linguistically naïve individual such as your humble correspondent does appear to have a root word, “emergent”. Here’s what dictionary.com tells us:
So it seems an emergency is “sudden” and unexpected” and that emergency is such a basic word it is known even to Elementary Level schoolchildren. As concerns the Forever Virus, if there was a sudden, urgent, unexpected occurrence requiring immediate action, that occurrence occurred two years ago and it ended, two years ago, because something that goes on and on and on for two years isn’t sudden.
To be fair, two years ago there was reason for treating the appearance of SARS-CoV-2 in Canada as an emergency, narrowly construed. Meaning, a problem for the old and comorbid population justifying simple, tailored, yet urgent actions to protect those populations and arm them with information about how to protect themselves. But then, as now, those seizing and exercising emergency powers had no interest in narrow construction. They fomented a broad-based panic among the population and parleyed their panic into sweeping powers which they use to command us to hide in our homes, cover our faces, and inject ourselves with experimental (albeit Very Scientific) pharmaceutical products which they call “vaccines” because labels have incredible power.
Not only is there now no emergency justifying these extraordinary powers, for most people there never was one either. The sources of evidence are legion but a very simple one is the publicly-available cause of death data compiled by Canada’s official government statistics agency, Statistics Canada. These data tell us not only that the risk of COVID to most people is non-existent when you consider it by itself, but that when you put it in the context of other common causes of death, it is just really not that bad.
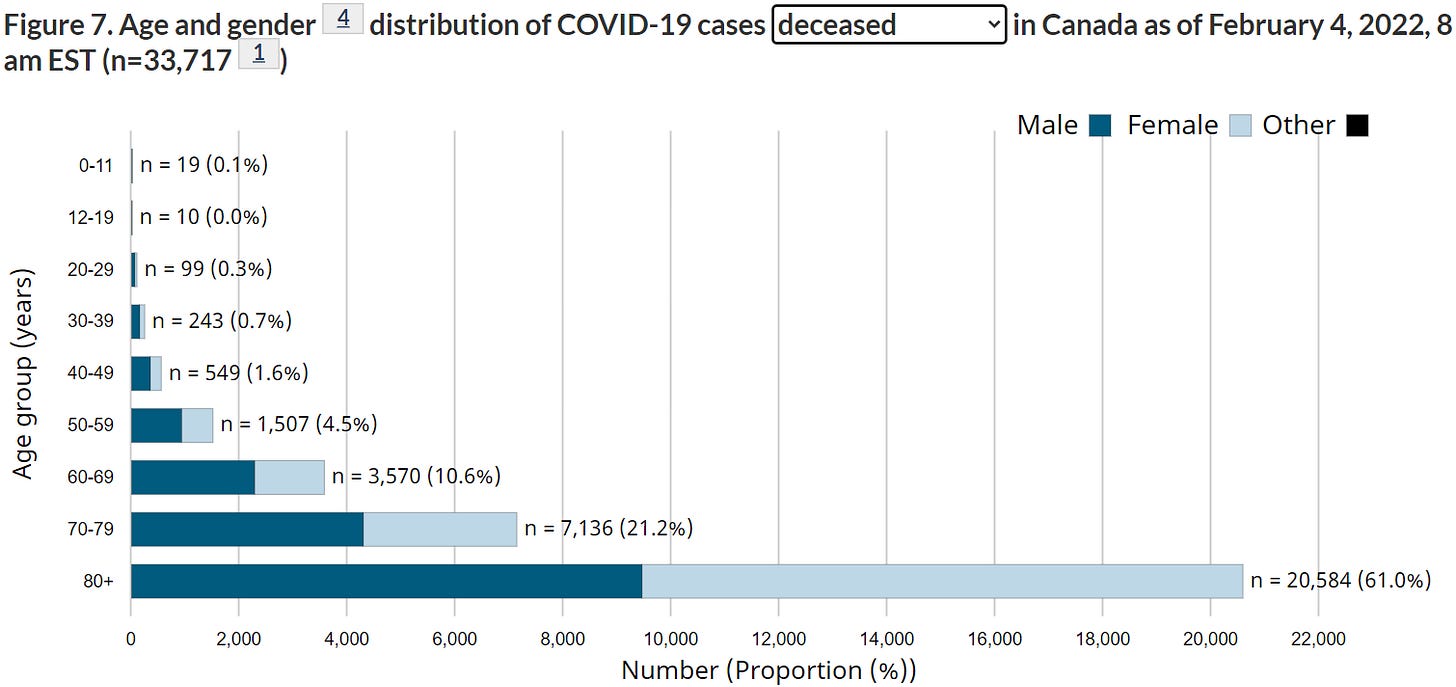
To lead into the cause of death data, StatsCan provides a simple histogram of total COVID-19 deaths (how many are with and how and how many are from, we do not know). Here’s their official histogram of deaths bucketed by age group since the beginning of the plandemic:
You can find this graph by browsing to this link, finding the heading entitled Hospitalizations and deaths to date, and switching the combo picker box from “hospitalized” to “deceased”.
As we roll into the twenty-third month of idiocracy, a country of 38 million people has experienced 33,717 deaths with some relationship to an infection with the SARS-CoV-2 virus, an annualized rate of 17,591 deaths in a country in which 296,920 (17×) people died of all causes in the pre-pandemic year of 2019. We can start to put these numbers into better perspective if we annualize them all, which we can do with a couple of minutes on a spreadsheet program:
The above chart presents the same data as the StatsCan histogram (upper, darker bar) above an annualized view of the same data (lower, lighter, bar).
With the annualized data we see, for example, that children aged 0–11 died of/with COVID in Canada at a rate of 10 per year, with those in the 12–19 category dying of/with COVID at a rate of 5 per year or, if you like, 0.5 per province per year. In the whole span of ages 0–19, we see 15 deaths per year. (Of course, as we know from the German study and the Johns Hopkins study, it is likely that precisely zero of these children, if they died with COVID-19, were healthy beforehand.)
The real key to making sense of the numbers is to compare them against the other numbers they are directly comparable to, namely the rate of deaths in the same age category from other causes.
And here again, Statistics Canada has the data. They offer an immensely detailed table, which in their infinite wisdom they have christened table 13-10-0392-01 (formerly CANSIM 102-0551), containing Deaths and age-specific mortality rates, by selected grouped causes, at an annual level, covering the years 2000 through 2020. I found the table a bit clunky to manipulate in the browser, but there’s a download option where you can get the whole dataset as CSV, about 94 MB all told, and load that baby into Excel. Then its pivot time.
If we isolate the data for the year 2019 to the age category 0–19, which is the sum of the first two age groups on the Statistics Canada histogram above, we see that 1,365 children and young adults in that age group died in 2019. Using these 2019 data, I have prepared a histogram of some of the key categories of deaths (not all, by far), which you can see in the bar chart immediately below.
The single biggest category of deaths in children and young adults aged 0–19 in 2019 was accidents, comprising 369 in total of which 169 were car accidents and 38 (not pictured) were from drowning. Suicides took the lives of 257 young people, and cancer another 188. Homicide killed 54, major cardiovascular disease 54 again. Eventually we make it down to influenza at 12 and pneumonia at11.
When we compare the 15 deaths per year in young people that (allegedly, according to the initial histogram from StatsCan) occur annually due to the Forever Virus, we see that the COVID deaths are, first, a drop in the bucket in comparison to all causes of death for young people. Second, that they are a trivial factor when compared to obviously preventable deaths like homicide, suicide, drowning, and car accidents. Third, that the number is absolutely comparable to the number in this age group who die every year of ordinary influenza and ordinary pneumonia. For young people, there was never any emergency at all, yet two years in the children sit eight hours a day on school buses and in schools, their mouths covered, being fed a steady died of propaganda by masked and fearful teachers because our society cannot do the most basic kinds of risk assessment, and because we cannot admit we were wrong.
Lets take a look at the same age category, 0–19, but now using 2020 data. This will show us what happened in the very year that the great scourge COVID-19 swept through our community like a broom sweeps through some grass your kid brought in from the yard! The 2020 graph is below.
Do you see anything funny about this graph? (Apart from a drop in total deaths?)
Hint, it’s that new line in the bar chart labeled COVID-19 and showing two deaths. So in the official government of Canada cause of death data for 2020 directly from Statistics Canada, the number of young Canadians who died of COVID-19 in 2020 is two. The StatsCan histogram we opened this article with claims the coof has now killed 29 young Canadians in this category, a rate of 15 per year and maybe 11 for the span from March to December of 2020. Yet their granular cause of death data says only two young people died of COVID-19 in 2020. Interesting stuff.
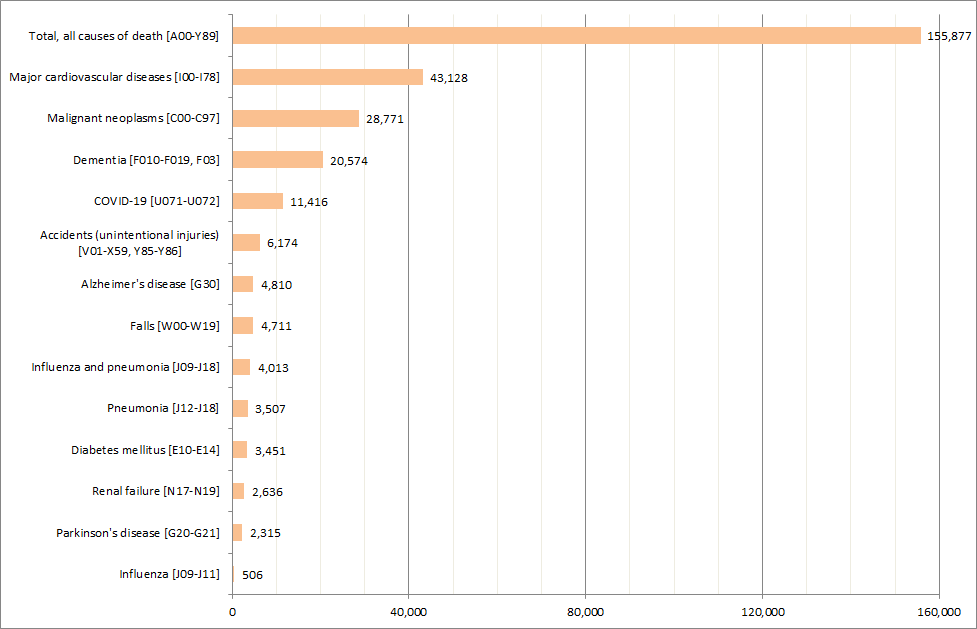
Let’s not think about that too hard. Instead let’s move on to look at causes of death in the absolutely worst hit age group, those 80 years old and older. Cutting to the chase, here is the histogram for selected causes of death in the 80+ bucket from the StatsCan cause of death data for 2020:
Again, this is the worst-hit group. It had 3× more deaths from the coof than the next worst group (ages 70–79) and 6× more deaths than the next next worse (ages 60–69). Yes this group had it relatively bad from COVID-19. But dementia took twice as many as the ro-ro. Dementia. Those eighty and older died at almost thrice the rate from cancer and more than 4× the rate from heart disease, which is widely considered to be preventable. A person in this the worst hit age group was only two times as likely to die from the Most Dangerous Disease ever, the Forever Virus COVID-19, than from falling down. Falling down, for crying out loud. This group comprises mostly the sick and frail, and they die of everything in large numbers.
This 80+ group was the worst hit by an absurd margin.
If you look at the tweener age groups, like for example the 50–59ers (I leave graphing it as an exercise for the reader), you see cancer, heart disease, and a dozen other causes of death trumping the coof. For 50–59 in 2020, it is 7,117 cancer; 3,929 heart disease; 1,610 accidents; and then some ways down the list 692 for alcoholic liver disease; 583 for diabetes; and 371 for COVID-19. You were almost twice as likely to drink yourself to death in that age group than to die of COVID. And 50–59 is considered by many to be a “somewhat at risk” category. There was never anything in this age group to justify a state of even temporary emergency.
We could have urgently protected the truly vulnerable, given folks true information and tools (not masks, plexiglass, and floor arrows) and let everyone else alone and we would have gotten to the same result without wrecking our society and pitting each of us against the other.
There may once, for a short time, have been a moderate emergency for the old and and the comorbid.
Now, two years later, there is none.


I would hazard that anyone below the age of 39 is more likely to die in the process of commuting to and from testing or injection sites, or in a mad panic throwing themselves at the mercy of the hospital system, than from the coof itself.
An interesting exercise would be to adjust the 2019 mortality numbers (perhaps several years' data normalized for pop growth and aging and then averaged) for the aging of the population (older demographics representing an increase share of the total population each year) as well as population growth itself. I have a feeling we would find there's no excess at all.