Denmark SSI report week 2022-01
Time series graphs from Statens Serum Institut show "vaccines" in serious trouble

Previous posts in series: (2021) #49 | #51
This series graphs COVID-19 “vaccine” efficacy in Denmark using the Danish Statens Serum Institut’s semi-regular Gennembruds-infektioner og vaccineeffectivitet report including the agency’s own efficacy estimates and confidence intervals. The whole body of SSI reports can be found in their Arkiv. This post updates the graphs to include data from the SSI report for week 1 of 2022, which has data up to January 4.
Notable
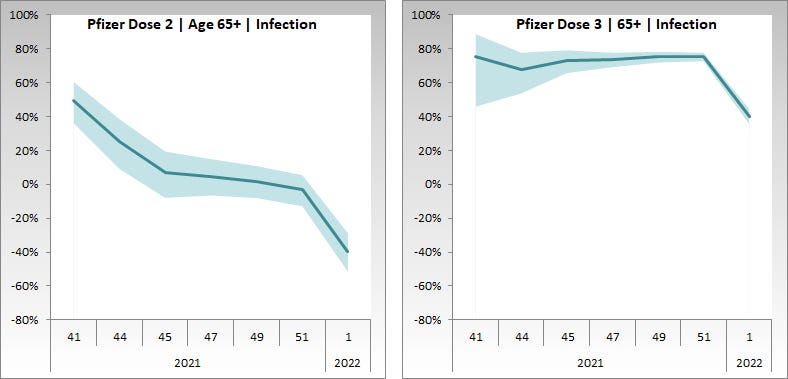
SSI calculates and publishes its own vaccine efficacy numbers, and this is what I graph in the efficacy section of the newsletter below. Before this week, the numbers were already bad. Last week they had the efficacy against infection the two-dose Pfizer regimen at -3% for age 65+. This week they are worse.
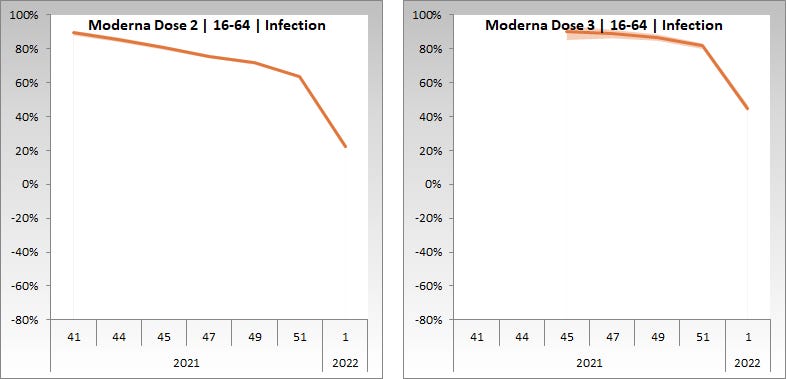
This week Pfizer dose 2 plummeted to -40% with the low end of the confidence interval at -52%. Meanwhile the two-dose Moderna regime for 65+ collapsed from positive 30% to negative 30% in just two weeks, a drop of 60 points. This is astonishing.
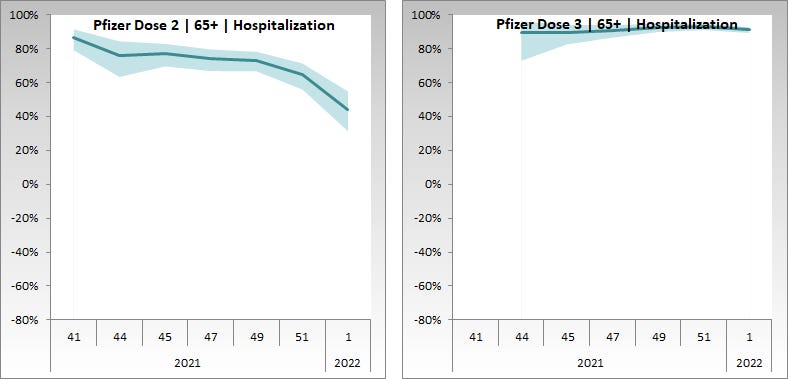
Most other numbers are declining, too, with Pfizer’s two-dose efficacy against hospitalization in the 65+ category down to 44% with the low-end of the confidence interval at 31%.
Efficacy against infection dropped so much this week that I had to extend the vertical axes in the efficacy section down from -40% to -80% to accommodate Pfizer’s current numbers, let alone “future growth”.
In case we have already forgotten, the 65+ population is the one that is most at risk, and a negative “vaccine” efficacy means the bad outcome you are trying to avoid by injecting yourself in fact becomes more probable after you receive the Science Juice than it was beforehand. No bueno, as the kids say.
This week debuts a new series of context graphs that break out various numbers by variant. These data are available every week in the SSI reports as running tallies, but it took me a certain amount of time, patience, and ExcelFu to manipulate them into week-over-week time series graphs. Enjoy!
Context Graphs
The context graphs show the course of the epidemic in Denmark during the period covered by the SSI reports. The first group of graphs is broken out by vaccine dose status, while the second group is by variant.
By Dose
In the first graph directly below, you can see the Danish booster campaign getting underway as of week 45 of 2021. As of week 1 of 2022, the Danes are behind the Brits on boosting by a full 10 points or so. (See the UKHSA data for week 1 plotted here.) The dropping teal line reflects the fact that SSI is moving boosted Danes out of the dose 2 category and into the dose 3 category. The sinister meaning of the violet and light blue lines continuing to drift up is most likely: they are going after the children.

The next two graphs show total “cases” (left) and hospitalizations (right) in Denmark classified by vaccine injection status. The black line represents “purebloods” or those who out of their own foolishness have refused to deal with the pricks. We observe “cases” for injected people continuing to shoot for the moon in week 1. We also observe a similar steep slope of increase in the boosted hospitalizations. It is worthy of some note that the black “never injected even once” lines have relatively consistent linear rates of increase and don’t feature parabolic jumps.

By Variant
The first graph below on the left shows total new infections in Denmark by variant, while the second shows dose 2 breakthrough infections by variant. It is probable that Danes who test positive within two weeks of receiving the Booster Juice are being put in the dose 2 bucket, so we are probably slightly overstating the dose 2 breakthroughs and understating the dose 3 breakthroughs.

The first graph below on the left shows dose 2 breakthrough hospitalizations broken out by variant. The final graph, below on the right, shows infections that have broken through even the extra health sauce we call the booster.

Efficacy Graphs
In all the graphs below the plotted efficacy percentages and 95% confidence intervals are taken directly from the SSI reports and were computed by SSI’s statisticians. The line represents the estimate while the shaded area represents the 95% confidence interval. The x-axis is report week, the y-axis is efficacy percentage and currently extends from -80% to 100%, as I had to stretch the y-axis this week to accommodate the scale of Pfizer’s failure.
These data are only available from week 41 onward and some of the booster and Moderna data only from later weeks. I apologize that in some of the graphs the titles obscure the line a bit. This annoyance should pay off in future weeks as the graphs will be comparable week over week, and the efficacy numbers will continue to drop.
Age 65+


Age 16-64


Miscellaneous Callouts
If you are interested in an in-depth analysis of other recent Danish data on “vaccine” efficacy, el gato malo dives into it here: