

UKHSA week 2022-07
England's dark winter of the boostinated continues

Previous posts in series: (2021) Wane’s world | #45 | #46 | #47 | #48 | #49 | #50 (2022) #1 | #2 | #3 | #4 | #5 | #6
This series graphs COVID-19 “vaccine” efficacy in the UK using UK Health Security Agency weekly vaccine surveillance report data, and applying the efficacy formulas used by our very scientific friends at Pfizer and Moderna. This iteration graphs the report for week 7, 2022.
Notable
I found an error in the part of my spreadsheet which generates the context graphs, specifically the infection, hospitalization, and death graphs, resulting in an undercount of the injected counts since UKHSA started reporting dose 3 numbers, which was week 3. I apologize for the error and have fixed it this week, though I likely won’t go back and amend weeks 3–6 since the error favoured the injections. See the context graphs section for more.
Boosting is officially over in England, as for the first time the campaign began the week-over-week change in dose 3 fell to the level of the week-over-week change in dose 2. I will keep the booster delta graphs for a few more weeks but stop mentioning it at the top unless the trend reverse itself.
Case rates for injected people have finally fallen back to where they were in week 36 of 2021, just at the end of August. There’s more to it than meets the eye though, so do take a look at the graphs and the analysis.
The slow motion train wreck that is
vaccineinjection efficacy in the the age groups 18–49 (at least) continues to worsen. I had to alter the graphs again to extend both vertical axes even further. Pray I don’t alter them any further.In all age groups from 18–69, booster efficacy against infection has now fallen below the efficacy experienced by those who have only two doses.
The Substacks are afire with the news that Public Health Scotland has decided to stop publishing its detailed weekly stats due to the fact that the proletariat persists in drawing unauthorized conclusions from them. Igor had the first story I’m aware of, then eugyppius and Berenson picked it up. The concern is that UKHSA will follow suit, but they have not done so this week at least. It seems to me that, given that SSI hasn’t dropped a new report since week 3 (in which they deleted key data), Denmark is also joining team “hide the decline” in force. Kevin Roche will be delighted.
Efficacy Graphs

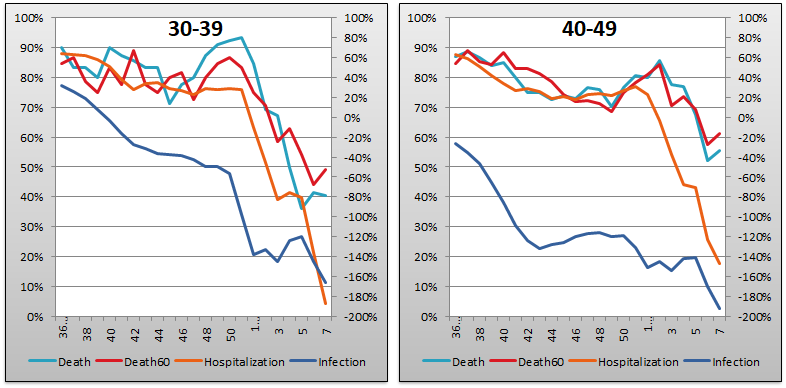


The above eight graphs show vaccine efficacy against infection, hospitalization, and death in each age group tracked in the UKHSA report. Efficacy against infection is plotted on the right y-axis because it is so bad it requires an axis that goes deep into the negatives. The x-axis is time (report week). Since week 3, 2022, the numbers are my estimates since the UKHSA has now stopped publishing the data on which this time series is based. See the Methodology section from my week 4 newsletter to understand how estimates are calculated from week 3, 2022 and following.
As the unmitigated disaster that is the vaccine injectable pharmaceutical product efficacy story continues to unfold, I have once again had to extend y-axes to be able to show the current numbers. I extended the left y-axis against which efficacy against hospitalization and death is plotted down from 20% to 0%, and the right y-axis, which scales efficacy against infection, down to -200%.
Context Graphs


The above graphs provide the wider-angle view of the state of the epidemic in the England. The first one shows the total percentage of the population injected with 1, 2 and 3 doses of injections so transcendentally Safe they would never kill teenage boys in their sleep and so monumentally Effective that COVID will be a thing of the past in no time flat.. The next three graphs show absolute total “case” counts, hospitalization counts, and death counts, respectively, broken out by vaccination injection status. Again the x-axis is time (report week). The counts are based on rolling four-week windows so divide by 4 to get a weekly number.
Correction: Over the past few weeks I have struggled to understand why, despite terrible numbers throughout the UKHSA report, the above contextual graphs appeared to show bad events falling quickly for injectees. I realized this week the facile explanation I gave last week—exorbitantly high “infection” numbers for non-injected youth aged 0–17—doesn’t explain the whole difference and looked into it more. It turns out that after UKHSA started separating dose 2 data from booster data in week 3, I forgot to update the definitions of “At Least 1 Dose” and “At Least 2 Doses” accordingly, resulting in an undercount of adverse data for injected persons in the above context graphs. I have corrected the mistake this week, and apologize for making it. Note that my reports for weeks 3, 4, 5, and 6 also have the same undercount problem. Note also that the error was to the benefit of the “vaccines”. Along with fixing the graphs, I have also added a separate “At Least 3 Doses” (i.e. boosted) series to the context graphs for this week.

The above two graphs show the change in percentage of the population entranced, tricked, and bullied into becoming experimental injectees from week to week in order to help your eye “zoom in” and assess the rate at which the Percent Injected, by Dose graph changed from last week to this one. The boosting delta fell again this week, to 0.2%, on par with the dose 2 delta. If it stays consistently at this level or falls further, I will remove these two graphs in a few weeks.
All data above this point are taken directly from the UKHSA reports. The below graphs show two views of excess mortality from other sources. The top chart shows excess death in England and Wales, taken from mortality.org’s STMF visualization toolkit, for the year 2022. The bottom chart shows excess deaths in the broader UK from January 2020 to the present day, taken from Our World in Data (direct link here). Astute readers will notice that the mortality.org data (top chart) shows excess mortality in the first four weeks of 2022 while the bottom one has a mortality deficit in England and Wales since the second week. I can’t say if one is right and the other wrong, or if this is just one more example of how worthless are the data that we have foolishly chosen to rely on.


Current Rates per 100K


The three bar charts above show the rates of infection, hospitalization, and death per one hundred thousand people broken out by age group. Here, the x-axis is age group, unlike the above charts which plot data over time on the x-axis.
This week, although the epidemic is receding in England for the time being, we see the booster’s efficacy against infection continuing to worsen visibly relative to both no injection at all and also relative to being injected with only 2 doses.
Booster efficacy against hospitalization and death is also receding. The recession is slower in the 80+ bucket and faster in the younger categories. For example last week in the 40–49 bucket the rates were 11.6 per 100,000 not injected versus 5.9 boosted for an implied booster efficacy of 49%. This week the numbers are 10.2/6.6/35%. That’s a big drop, very fast.
One interesting artifact is the number of deaths per 100K being higher in the 80+ category than number of hospitalizations. I don’t know what to make of that, but the “Never Injected” and “Dose 3 Only” numbers come directly from UKHSA and that’s what the report says. As explained in week 4, “Dose 2 only” is a calculated estimate.
Other Points of Interest
Once again, I commend unto you Igor’s analysis of this week’s report.

How can anyone hide anything? Even this life insurance CEO gave up the goods: https://www.zerohedge.com/medical/life-insurance-ceo-says-deaths-40-among-those-aged-18-64-and-not-because-covid
I would love to see data on how the 'mass psychosis' is going: How many people are true believers? How many are just going along to avoid job loss? How many to avoid embarrassment? How many enjoy masks because they can hide in plain sight? How many are genuine convoy supporters and know everyone's being lied to? Questions are endless.