
UKHSA week 2022-12
UKHSA week 2022-12
As the vaccine efficacy continues to get worse, is something interesting brewing in the excess mortality numbers?

Previous posts in series: (2021) Wane’s world | #45 | #46 | #47 | #48 | #49 | #50 (2022) #1 | #2 | #3 | #4 | #5 | #6 | #7 | #8 | #9 | #10 | #11
This series graphs COVID-19 “vaccine” efficacy in the UK using UK Health Security Agency weekly vaccine surveillance report data, and applying the efficacy formulas used by our very scientific friends at Pfizer and Moderna. This iteration graphs the report for week 12, 2022.
Notable
Given we haven’t reached “early April” yet, this iteration of the UKHSA report hasn’t commenced the promised data hiding. So we have a full report this week and presumably at least one more week of good data on March 31st before the UKHSA shuts us down.
This week, like last week and most of the weeks before it, efficacy against infection continued to decline across the board.
Despite some small upticks,
vaccineinjection efficacy against hospitalization and death also continued to decline.The absolute number of deaths reported in the population of individuals never injected declined to a new lowest number on record this week, but we must expect it to begin rising either next week or the week after.
Hospitalizations are now rising in all populations, but disproportionately so in those with one, two, and three doses of Very Safe and Effective health sauce.
Injection uptake, including boosterism, is still at rock bottom levels despite the recent rise in test-detected infections in now hospitalizations, so we continue to see encouraging signs that COVID hysteria and
vaccineinjection obsession may be a spent force in England.A distinct and consistent number of excess deaths have occurred among males in the first nine weeks of 2022, while there has been no excess mortality, and at times a slight mortality deficit, in the female population during the same period of time. This seems anomalous both when compared to earlier years, and when considered in light of the statistical definition of excess mortality.
Efficacy Graphs


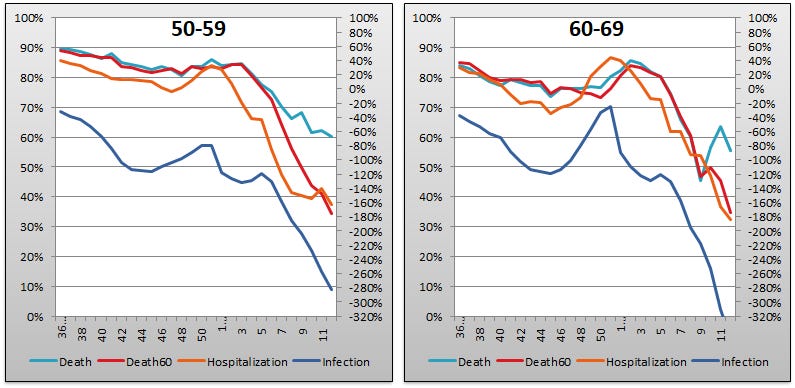

The above eight graphs show vaccine efficacy against infection, hospitalization, and death of in each age group tracked in the UKHSA report. Efficacy is determined in the same way that Pfizer and Moderna calculated it in the clinical trials (before they aborted them due to Very Ethical Reasons) by calculating the number of bad outcomes “prevented” by being “fully vaccinated” with at least two doses of the injectable pharmaceutical products in comparison to the control population of non-injected people. For the purposes of these graphs, boostered folk are included in the “fully vaccinated” alongside the simple double dosers. Negative efficacy tells us that the injections may cause more bad outcomes than would occur naturally.
Efficacy against infection is plotted on the right y-axis because it is so bad it requires an axis that goes deep into the negatives. The x-axis is time (report week). Since week 3, 2022, the numbers are my estimates since the UKHSA has now stopped publishing the data on which this time series is based. See the Methodology section from my week 4 newsletter to understand how estimates are calculated from week 3, 2022 and following.
There are some interesting, but not obviously meaningful, upticks in vaccine efficacy against hospitalization and death in a few of the age groups, alongside continued decline in other age groups, so it is a bit of a mixed bag this week. Efficacy against hospitalization in the all-important 80+ age group is still trending toward zero driven by terrible efficacy both for the two-dose regimen and the booster. The decoupling of the Death (“death within 28 days of positive COVID-19 test”) and Death60 (“death within 60 days of positive COVID-19 test”) curves observed last week is generally continuing but seems to be reversing in age group 40–49. I shall have to extend the left-hand y-axis next to ensure the negative efficacies for hospitalization and death can be observed.
The blue line representing efficacy against infection is down everywhere this week whilst hitting a new low of -352% in the 60–69. Yes, negative three-hundred-fifty-two percent. It’s off the chart again in this age group.
Context Graphs


The above graphs provide the wider-angle view of the state of the epidemic in the England. The first one shows the total percentage of the population injected with 1, 2 and 3 doses of the Very Safe and Scientific injectable health serum from Pfizer, Moderna, et al. The next three graphs show total absolute “case” counts, hospitalization counts, and death counts, respectively, broken out by vaccination injection status. Again the x-axis is time (report week). The counts are based on rolling four-week windows so divide by 4 to get a weekly number.
Deaths in the Selfish and Science Denying crowd of Neanderthals who never took a single dose of the injections have against all the odds once again hit a new lowest level ever recorded since the dawn of PHE/UKHSA report time. The same cannot be said of the Science Loving Kindhearts who took one, two, or there doses of the Very Effective pharmaceuticals. Deaths amongst these injected folk are still also declining but have yet to reach a record low.
New this week, we see that last week’s increase in “cases” has now spilled over into hospitalizations, as expected, given that hospitalizations lag infections. By the same token next week or the week after we should expect to see an increase in deaths, assuming the UKHSA hasn’t started hiding the report data by then. Similarly to last week, note the slopes on the hospitalization graph. The black Never Injected line increased by 499 while the boosted At Least 3 Doses line increased 1,339.

The above two graphs show the change in percentage of injected individuals from week to week in order to help your eye “zoom in” and assess the rate at which the Percent Injected, by Dose graph changed from last week to this one.
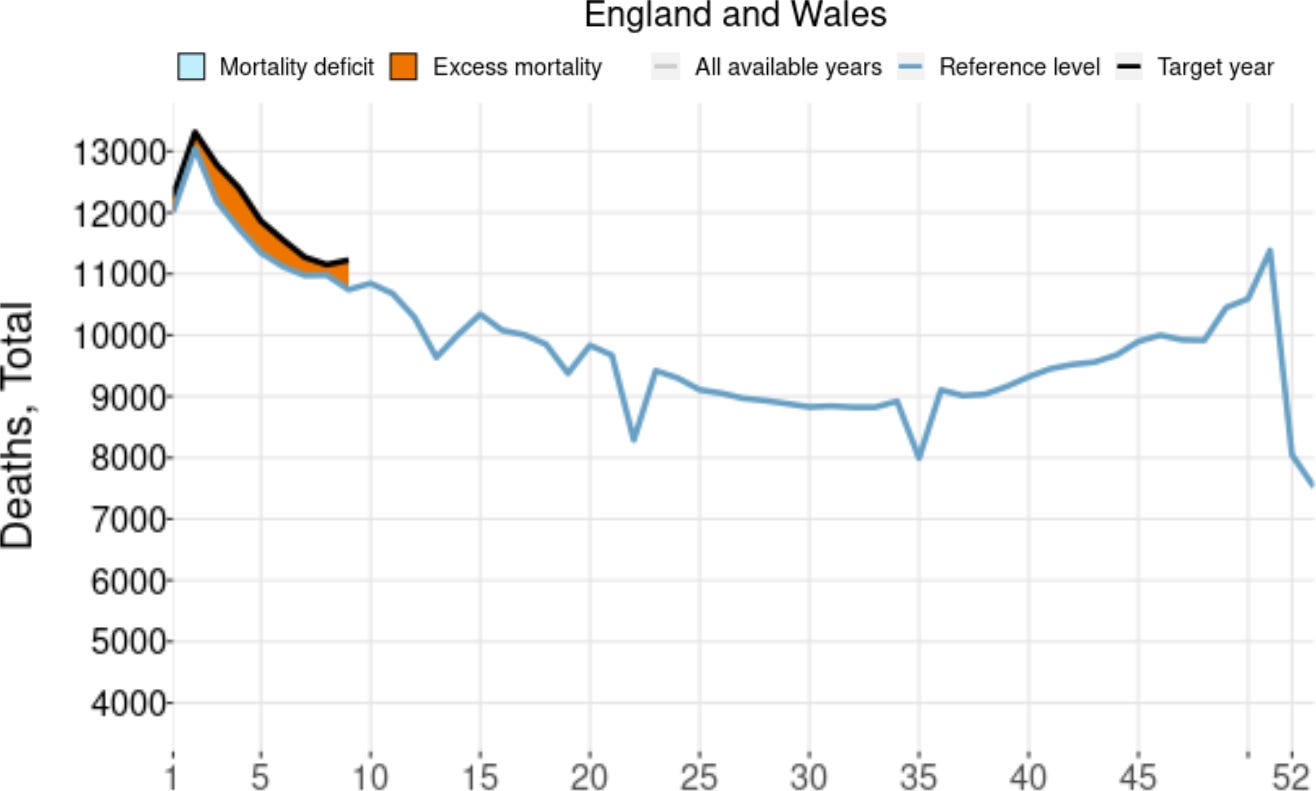
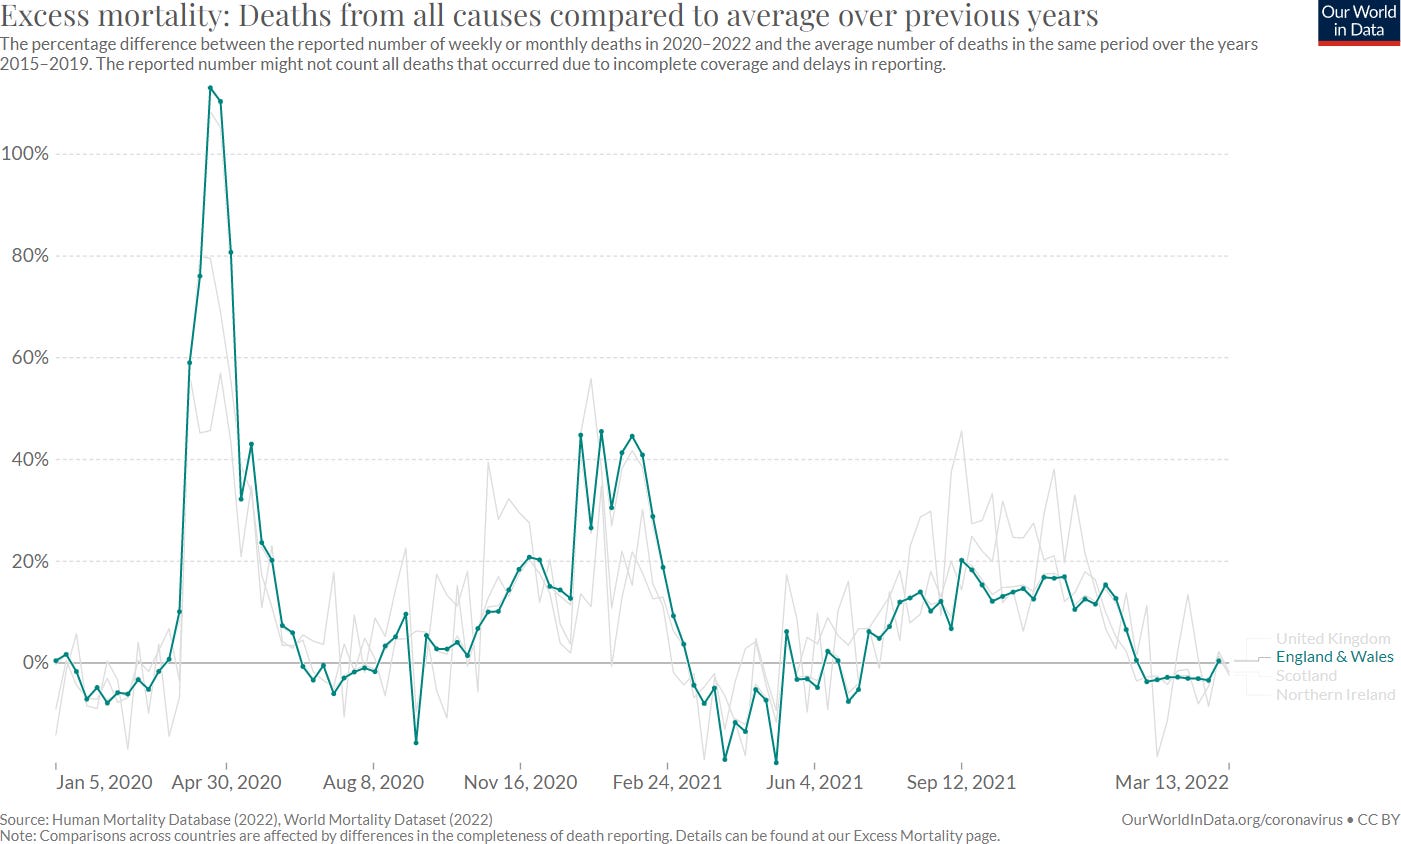
All data above this point are taken directly from the UKHSA reports. The below graphs show two views of excess mortality from other sources. The top chart shows excess death in England and Wales, taken from mortality.org’s STMF visualization toolkit, for the year 2022, using 2010–2019 for the reference level. The bottom chart shows excess deaths in the broader UK from January 2020 to the present day, taken from Our World in Data (direct link here), and using 2015–2019 for the reference level. The mortality.org data show excess mortality for the first 9 weeks of 2022, driven entirely by excess deaths in males. The Our World in Data is now also showing excess deaths in England and Wales at the week of March 6, for the first time in 2022.
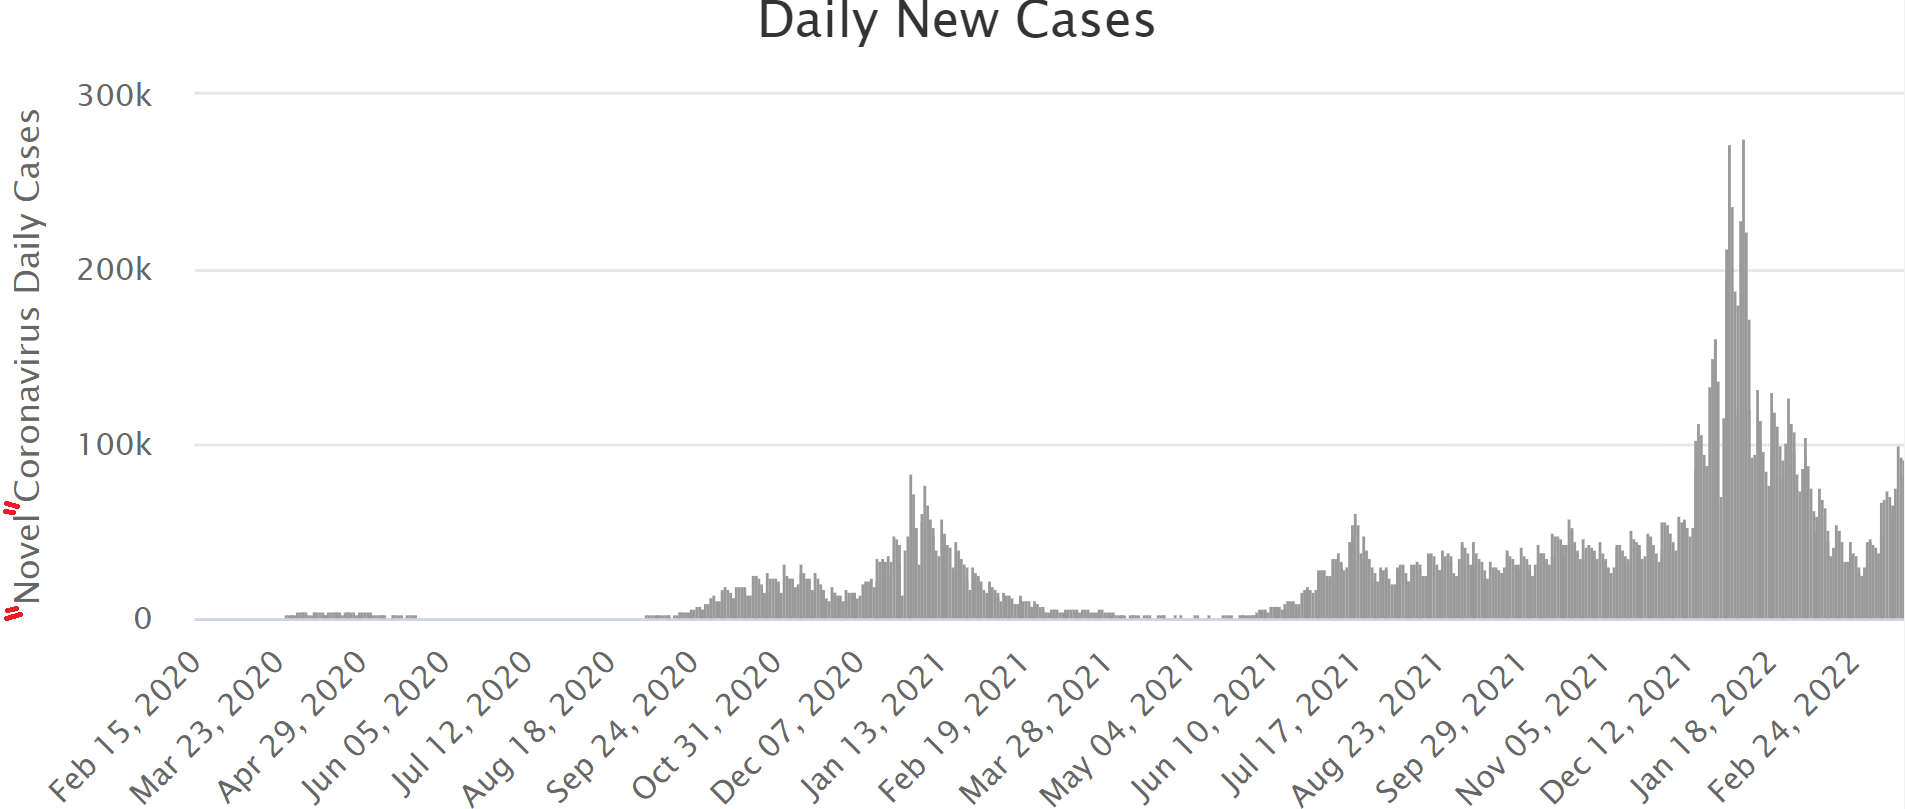
For one last element of context, the graph below shows daily new COVID-19 “cases” in the UK over the entire plandemic, courtesy of Worldometer. This graph is helpful to see the up-to-the-minute situation (because the absolute numbers from the UKHSA report are summed across a four week sliding window, a practice which dampens the signal from more recent events; but keep in mind the UKHSA report is for England only, whereas the Worldometer data cover the entire United Kingdom). This week’s edition doesn’t have the beautiful hand-drawn annotations from last week, so check back to week 11 if you want to see key dates marked out.
Current Rates per 100K
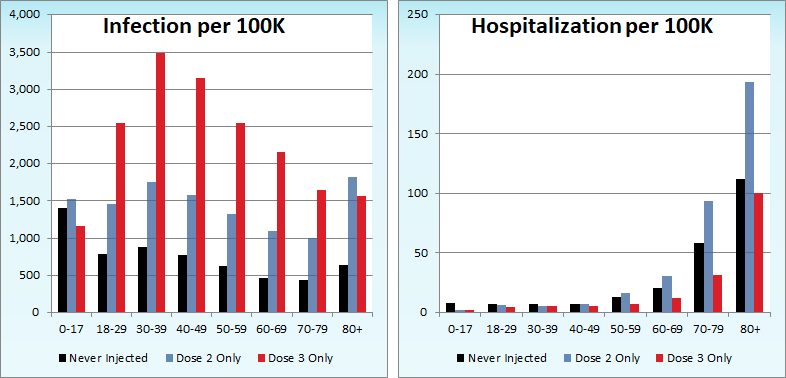

The three bar charts above show the rates of infection, hospitalization, and death per one hundred thousand people in England, broken out by age group. Here, the x-axis is age group, unlike the above charts which plot data over time on the x-axis. The data source is once again the UKHSA vaccine surveillance report.
Apart from the obvious fact that the rate of infections per 100K in individuals of the boosty persuasion is something like 4X–5X the rate in people who didn’t get any shots at all, across all ages from about 18 to 79, the main story here is the continued erosion of the booster’s effectiveness against hospitalization in the crucial 80+ vintage. Last week the booster had an implied efficacy against hospitalization of 18%. This week it is 11%, as the red Dose 3 Only case hospitalization rate creeps ever closer to the dark Never Injected bar. Will the booster reach zero efficacy by week 13? Will it reach zero efficacy before the UKHSA starts hiding the data? Subscribe now to find out!
Every so often I remove the ages 60+ from the hospitalization and death rate graphs to provide a more zoomed-in picture of what’s happening in the younger age groups. Here are these zoomed-in graphs for this week:

Other Points of Interest
I have been including a graph of excess mortality in the England and Wales with this weekly series since week 48 of 2021. I always use mortality.org’s aggregated excess death chart, but they also offer charts of excess deaths broken down by sex. Since the start of 2022, the mortality.org has shown nine consecutive weeks of fairly solid excess death among men and zero excess deaths (or a death deficit) among women.
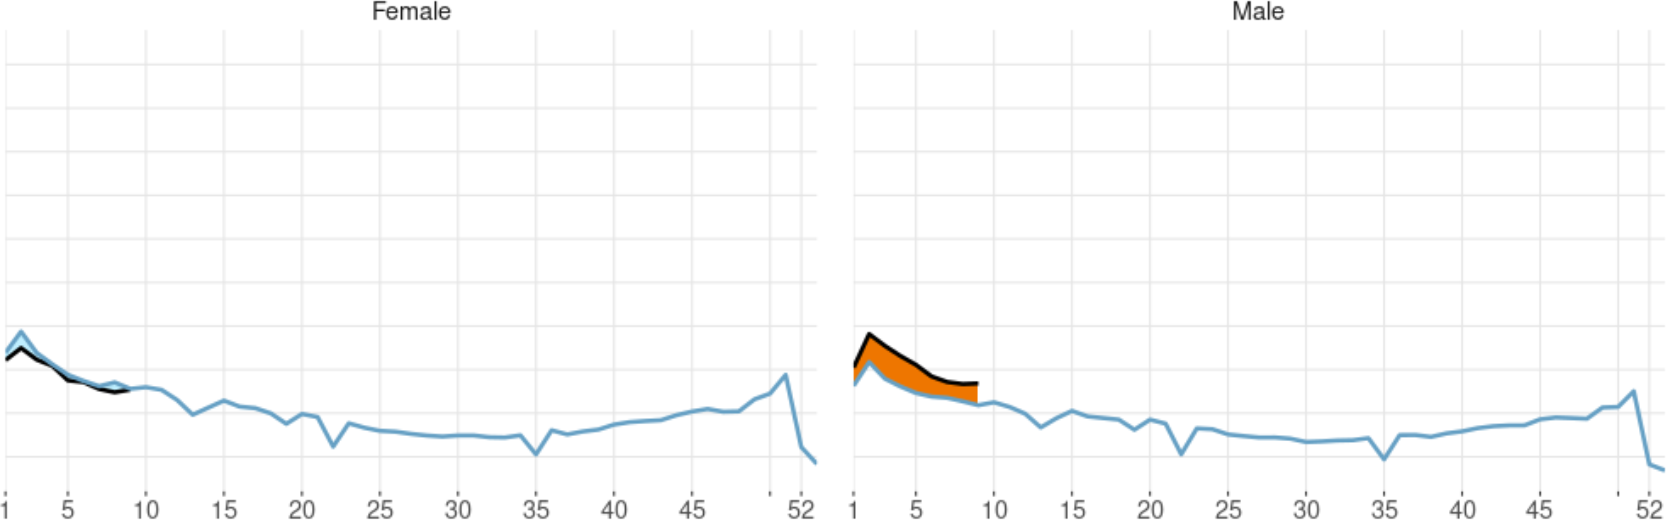
The mortality.org data from Scotland show a similar trend. I don’t know much about excess mortality but it seems anomalous to me; and, for what it’s worth, I can’t find a comparable period of sex-based mortality discrepancy in England and Wales browsing the mortality.org data back to 2011. Very odd.
Statistics AND jokes. Nice one, Abhijit :D
Due to the age-stratified impact of this disease, efficacy calculations in relation to hospitalization, death and death 60 are perilously close to uninformative for anybody below the age of 40. Is excess mortality for males a function of worse adverse event profile for men re: these injections, the disparate impact [turning society into a prison] has on men; or a little bit of both?